Invoice OCR vs AI Data Capture: Which Is More Accurate?
Short answer: automated invoice processing is only as accurate as its data capture method. OCR on...
Every finance leader knows that processing invoices costs money. Fewer can say exactly how much each invoice costs their team. That gap between awareness and measurement is where real savings hide, and where the business case for invoice processing automation either gets built or stalls.
This guide breaks down the true cost per invoice for manual, semi-automated, and fully automated AP workflows. You will find published benchmarks, a formula for calculating your own cost per invoice, a side-by-side comparison of processing methods, and guidance for building an automation business case your CFO can act on.
Kefron AP helps mid-market finance teams cut invoice processing time by up to 80% using AI-powered data capture and automated approval routing. If you are benchmarking your own AP costs, the numbers below will show you where you stand and what a realistic improvement looks like.
Cost per invoice is the total expense your AP team incurs to process a single supplier invoice from receipt to payment-ready status. It includes labour for data entry, validation, approval routing, exception handling, and filing. It also includes the technology, overhead, and management time allocated to the AP function.
The formula is straightforward: divide your total monthly AP cost (labour plus systems plus overhead) by the total number of invoices processed that month. An AP team of two people at a fully loaded cost of $55,000 each, handling 800 invoices per month, has a cost per invoice of approximately $11.46.
This metric matters because it gives you a single number to benchmark against industry data. Without it, you are making decisions about automation investment based on gut feeling rather than measurable financial performance.
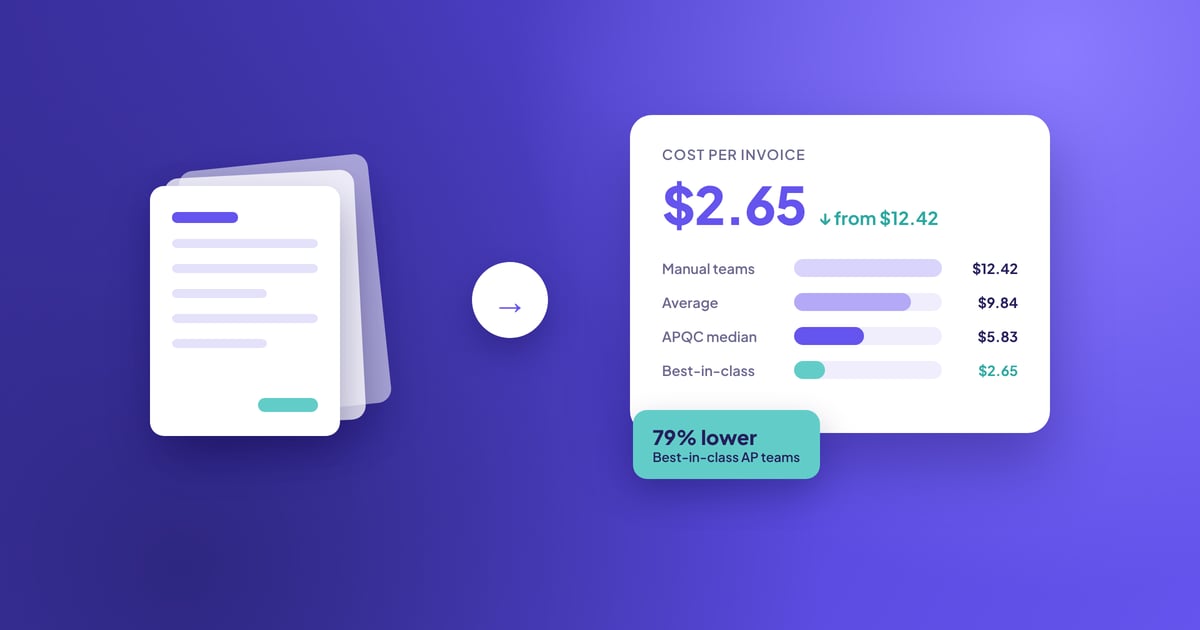
Ardent Partners' State of ePayables 2025 report, based on a survey of 204 AP and finance professionals, puts the average all-in cost per invoice at $9.84 with an average processing time of 8.2 days. Those numbers represent the full AP lifecycle: capture, validation, matching, approval, exception handling, and posting.
The gap between top performers and everyone else is significant. Ardent defines "best-in-class" as the top 20% of organisations on cost and processing time. Those teams process each invoice for $2.65 in 2.9 days. All other organisations average $12.42 per invoice and 13.5 days.
APQC's cross-industry benchmarking data from 1,485 organisations reports a median cost of $5.83 per invoice. The top quartile processes invoices at $2.07 or less, while the bottom quartile pays $10 or more. Industry medians range from $1.14 in distribution and transportation to $9.43 in the public sector.
Your cost per invoice is shaped by how many human touches each invoice requires. Every manual step adds time, and time is where most of the cost sits. Understanding what drives costs up helps you identify which part of the process will deliver the most savings when automated.
Data capture and entry account for 30% to 35% of total invoice processing cost. This includes typing header fields (supplier name, invoice number, dates, amounts) and line-item details into your accounting system. An experienced AP clerk processes 25 to 40 invoices per day manually, each taking 4 to 15 minutes.
AI-powered invoice data capture eliminates this step entirely. Instead of keying every field, the system reads the invoice, extracts header and line data, and assigns a confidence score to each field. Only low-confidence fields go to a person for review.
Exception handling represents 20% to 25% of total cost. Exceptions occur when an invoice does not match the purchase order, when data is missing, when a supplier disputes an amount, or when duplicate invoices appear. Ardent Partners reports an average exception rate of 18.4%, with best-in-class teams achieving 11.1%.
Many exceptions trace back to data entry errors upstream. When extraction accuracy improves, PO matching works correctly, and exceptions drop. This is why investing in accurate data capture has a compounding effect on total AP cost.
Approval routing accounts for 15% to 20% of cost. In manual workflows, invoices are routed by email, passed physically between desks, or held in shared inboxes. Follow-ups consume AP staff time, and every day an invoice sits unapproved adds risk of late payment penalties and lost early payment discounts.
Automated approval workflows route invoices to the right approver based on configurable rules, send reminders, and escalate when deadlines approach. This removes the manual chase from your AP team's workload.
Validation and matching consume 10% to 15% of cost. This includes three-way matching (invoice to purchase order to goods receipt), duplicate detection, and verifying tax calculations. Manual matching is slow and error-prone, especially for invoices with multiple line items, partial deliveries, or foreign currencies.
Automated three-way matching compares invoice data against purchase orders and delivery receipts at line level. Clean matches process without human intervention. Discrepancies are flagged for review with the relevant data pre-loaded.
Filing and retrieval represent 5% to 10% of cost. Physical filing is becoming less common, but even digital filing requires organisation, naming conventions, and retrieval protocols for audits and supplier queries. Poor filing creates hidden costs when your team spends time searching for documents during month-end close or external audits.
The difference between manual and automated invoice processing is not just about speed. It changes cost structure, error rates, capacity, and the kind of work your AP team spends their time on. Here is how the two approaches compare across the metrics that matter.
| Metric | Manual Processing | Automated Processing |
|---|---|---|
| Cost per invoice | $9.84 to $12.42 | $2.07 to $2.65 |
| Processing time | 8.2 to 13.5 days | 2.9 days or less |
| Exception rate | 18.4% to 20.9% | 11.1% or lower |
| Straight-through processing | Under 20% | 35.4% to 80% |
| Invoices per FTE per month | 350 to 800 | 2,000+ |
| Data entry errors | 3% to 5% | Under 0.5% |
A manual AP clerk handles 500 to 800 invoices per month. With automated data capture, one person can oversee thousands because they only review exceptions rather than processing every document.
For a company handling 1,000 invoices per month, the difference between $12.42 and $2.65 per invoice adds up to roughly $117,000 per year. That number grows with volume, while automated costs remain relatively flat.
You need four numbers to benchmark your AP operation accurately. Gather these from your finance and HR teams, then compare them against the industry benchmarks above.
Include salaries, benefits, employer taxes, and allocated overhead for everyone who touches invoices. Count AP clerks, managers who approve invoices, and any IT staff maintaining AP-related integrations. If AP responsibilities are shared across roles, estimate the percentage of time each person spends on invoice processing and prorate accordingly.
Include everything: PO-backed invoices, non-PO invoices, credit memos, recurring invoices, and intercompany invoices. Undercounting volume inflates your per-invoice cost and distorts the benchmark comparison. Pull this from your accounting system rather than estimating.
Track exceptions for one full month. An exception is any invoice that requires manual intervention beyond standard processing. This includes PO mismatches, missing fields, supplier disputes, duplicate flags, and approval escalations. The industry median is 18.4%. If yours exceeds 25%, exception handling is likely your single largest cost driver.
Calculate the average elapsed time from invoice receipt to payment-ready status. The industry median is 8.2 days for manual workflows and under 3 days for automated ones. If your cycle time exceeds 10 days, you are likely missing early payment discounts and incurring late payment penalties.
Once you have these four numbers, divide your total monthly AP cost by your invoice volume. Compare the result against Ardent Partners' benchmarks: under $3 is best-in-class, $5 to $10 is average, and above $12 indicates significant room for improvement. Kefron AP's invoice processing calculator can help you model the potential savings specific to your volume and current costs.
Invoice processing costs vary by industry because of differences in invoice volume, complexity, regulatory requirements, and approval structures. Use the benchmarks below to compare your cost per invoice against organisations in your sector.
| Industry | Typical Monthly Volume | Average Manual Cost per Invoice | Primary Complexity Driver |
|---|---|---|---|
| Manufacturing | 2,000 to 8,000 | $18 to $25 | Multi-line POs, partial shipments, foreign currency |
| Distribution and Wholesale | 3,000 to 15,000 | $12 to $18 | High volume, tight margins, standard formats |
| Healthcare | 1,000 to 5,000 | $20 to $30 | Regulatory compliance, multi-payer structures |
| Professional Services | 300 to 1,500 | $15 to $22 | Multiple approvers, time-and-materials billing |
| Construction | 500 to 3,000 | $22 to $35 | Progress billing, change orders, retainage |
| Financial Services | 1,000 to 10,000 | $15 to $20 | Compliance requirements, audit trail depth |
Construction consistently has the highest per-invoice cost because progress billing invoices require reconciliation against contracted milestones and retainage schedules. A single construction invoice can take 20 to 30 minutes to process manually.
Distribution has a lower cost despite high volumes because invoice formats are standardised. Regardless of industry, organisations with manual workflows pay significantly more per invoice than those using AI-powered extraction.
The cost-per-invoice formula captures direct processing expenses, but manual workflows carry additional costs that rarely appear in the calculation. These hidden costs can equal or exceed the direct processing expense.
According to Ardent Partners' research (2025), companies with manual AP workflows capture only 20% to 30% of available early payment discounts. On $10 million in annual payables with standard 2/10 net 30 terms, missed discounts total $140,000 to $160,000 per year. Automated processing brings capture rates above 80% because invoices reach payment-ready status faster.
Slow processing leads to late payments, which trigger penalties and damage supplier relationships. When your average cycle is 13.5 days and terms are net 30, nearly half your available time is consumed before the invoice is approved. Add approval backlogs and payment-run scheduling, and late payments become structural.
APQC benchmarking data indicates that duplicate or erroneous payments run 0.8% of annual disbursements for top-performing organisations and 2% for bottom performers. On $50 million in annual payables, a 2% error rate represents $1 million in payments that should not have been made. Recovery is possible but time-consuming and costly.
Repetitive manual data entry contributes to AP staff burnout and turnover. Replacing and training a new AP clerk disrupts workflow, introduces errors during the learning period, and diverts management attention. Automating the most repetitive tasks lets your team focus on higher-value work such as vendor management, cash flow analysis, and financial reporting.
AP automation reduces cost per invoice by eliminating manual steps, reducing errors that cause rework, and increasing the volume of invoices each team member can oversee. Here is how invoice processing software addresses each cost driver.
Automated invoice processing uses AI and Optical Character Recognition (OCR) to read invoices in any format: PDF, scan, email, or electronic file. The system extracts header and line-item data, assigns confidence scores, and routes only low-confidence fields for review. Kefron AP achieves 99% data accuracy, so your team handles exceptions rather than re-entering every field.
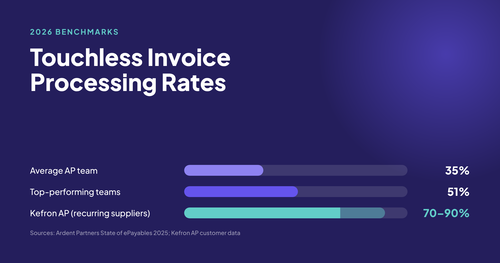
Automated three-way matching compares each invoice against its purchase order and goods receipt at line level. Clean matches process straight through without human involvement. Discrepancies are flagged with the relevant details pre-loaded for quick resolution. Best-in-class teams achieve straight-through rates between 35% and 80%.
Configurable approval workflows route invoices to the correct approver based on amount thresholds, cost centres, departments, or project codes. Automated reminders and escalation rules prevent invoices from sitting in approval queues. This shortens the overall invoice cycle and protects early payment discount opportunities.
Validated invoice data posts directly to your ERP or accounting system through API or secure file transfer. Kefron AP connects to over 70 ERP and accounting systems, including Sage, Oracle, SAP, Microsoft Dynamics, and AccountsIQ. This removes the final manual step and maintains a complete digital audit trail from invoice receipt to ledger posting.
A strong business case for AP automation starts with your current cost per invoice and projects the financial impact of moving to automated processing. Here is a framework your finance team can use.
Use the four-step calculation above to establish your baseline cost per invoice. Multiply it by your monthly volume and annualise the result. A company processing 1,500 invoices per month at $12 per invoice spends $216,000 per year on invoice processing alone. That figure does not include missed discounts, late fees, or duplicate payment leakage.
Apply a target cost per invoice based on your expected automation level. Best-in-class organisations achieve $2.65 or less. For a conservative projection, use $4 to $5 per invoice, which assumes semi-automated to fully automated processing with human review for exceptions. At $4 per invoice, the same 1,500-invoice operation costs $72,000 per year, a saving of $144,000.
Layer in the savings from early payment discount capture, late fee elimination, and reduced duplicate payments. These secondary savings often exceed the direct processing cost reduction. Early payment discounts alone can add $50,000 to $100,000 in annual savings for mid-market organisations with $10 million or more in payables.
Automation does not always mean reducing headcount. It often means redirecting your existing team from data entry to vendor management and cash flow planning. Your AP automation business case should address both the financial savings and the strategic reallocation of team capacity.
Not every AP automation platform delivers the same cost reduction. When evaluating solutions, focus on the capabilities that directly affect your cost per invoice and the total cost of ownership over time.
The accuracy of data capture determines how much manual review your team still needs to perform. Look for AI-powered extraction that handles invoices in multiple formats without requiring supplier-specific templates. Template-based OCR keeps costs above $3 per invoice because of ongoing maintenance. Layout-agnostic AI extraction pushes costs below $1 for clean invoices.
Header-only matching misses discrepancies at the line-item level, which is where many exceptions originate. Make sure the platform supports line-level three-way matching between invoices, purchase orders, and goods receipts. This is a critical factor in achieving high straight-through processing rates.
Posting validated data directly to your ERP system is where the final manual step disappears. Evaluate the number and depth of pre-built connectors, and check whether the integration supports real-time posting or batch transfer. Kefron AP offers 70+ ERP connectors, covering Sage, Oracle, SAP, Microsoft Dynamics, and more.
Per-user pricing can inflate costs as your team grows. Volume-based pricing, where cost tracks the number of invoices processed, provides more predictable spend and scales naturally with your business. Ask vendors to quote against your actual invoice volume and mix, not a generic tier.
A platform that takes months to implement delays the cost savings you are trying to capture. Look for guided onboarding, dedicated support, and a realistic go-live timeline. Ask for reference customers at a similar scale and complexity to validate the vendor's claims.
The cost to process an invoice has decreased steadily over the past decade as automation adoption has grown. Understanding this trend helps you set realistic expectations for where your team should be today and where the market is heading.
Ardent Partners reported an average cost per invoice of $15.96 in its 2017 research. By 2025, that figure had fallen to $9.84. The best-in-class figure also dropped from approximately $4 to $2.65 over the same period. This reflects wider adoption of AI-powered capture and better ERP integrations.
According to the IFOL Accounts Payable Automation Trends 2025 report, 73% of finance teams are still not fully automated and 27% have no automation at all. The opportunity to close the gap remains substantial for most organisations.
The AP automation market reflects this. Grand View Research projects growth from $3.07 billion (2023) to $7.1 billion by 2030, a 12.5% compound annual growth rate.
Your cost per invoice is the clearest measure of AP efficiency you have. It combines labour, technology, overhead, and error rates into a single number that you can benchmark, track, and improve over time.
Start by calculating yours using the four-step method in this guide. Compare it against the industry benchmarks. If your cost exceeds $5 per invoice, automation will deliver measurable savings. If it exceeds $10, the business case is likely compelling enough to justify a formal evaluation.
Kefron AP gives mid-market finance teams a clear path from manual processing to automated AP. AI-powered data capture at 99% accuracy, automated three-way matching, and integration with 70+ ERP systems deliver lower costs, faster cycle times, and an AP team focused on financial management.
A good cost per invoice is under $3, which aligns with Ardent Partners' best-in-class benchmark of $2.65. The average is $9.84. If you are above $10, there is significant room for improvement through automation. Kefron AP helps finance teams reduce their cost per invoice by automating data capture, matching, and approval routing.
Divide your total monthly AP cost (labour, technology, overhead) by the number of invoices processed that month. Include all invoices: PO-backed, non-PO, credit memos, and recurring. This gives you a fully loaded cost per invoice that you can track over time and benchmark against industry data.
Ardent Partners' 2025 survey of 204 AP professionals reports an average of $9.84 per invoice with 8.2 days processing time. APQC's cross-industry data gives a median of $5.83. The actual number varies by industry, company size, and automation level.
AP automation reduces costs by eliminating manual data entry, automating PO matching, and routing approvals through configurable workflows. Kefron AP uses AI-powered extraction at 99% accuracy to capture invoice data without human keying. Automated three-way matching processes clean invoices straight through, and your team only handles flagged exceptions.
Touchless invoice processing means an invoice moves from receipt to ERP posting without any manual intervention. It requires accurate data capture, automated matching, and rules-based approval. Kefron AP enables touchless processing for invoices that meet all matching and validation criteria, freeing your team to focus on discrepancies and strategic work.
Most mid-market organisations see return on investment within 9 to 12 months of going live with AP automation. The timeline depends on invoice volume, current processing costs, and the proportion of invoices that can be processed touchlessly. Higher volumes and higher current costs typically mean faster payback.