7 Best AP Automation Tools for Paper Invoice Analytics (2026)
Paper invoices still account for a significant share of accounts payable volume in mid-market...
Your accounts payable department generates a lot of data. The challenge is knowing which numbers actually tell you something useful about how your team is performing. Tracking the right accounts payable metrics helps you spot bottlenecks, protect cash flow, and give your CFO the reporting they need to make confident decisions.
This article breaks down 10 accounts payable metrics that mid-market finance leaders should prioritise. Each metric includes a clear definition, the formula behind it, and practical guidance on why it matters. Kefron AP helps finance teams automate the processes that feed these metrics, giving you reliable data without the manual effort.
These are the numbers that separate reactive AP teams from proactive ones, regardless of invoice volume.
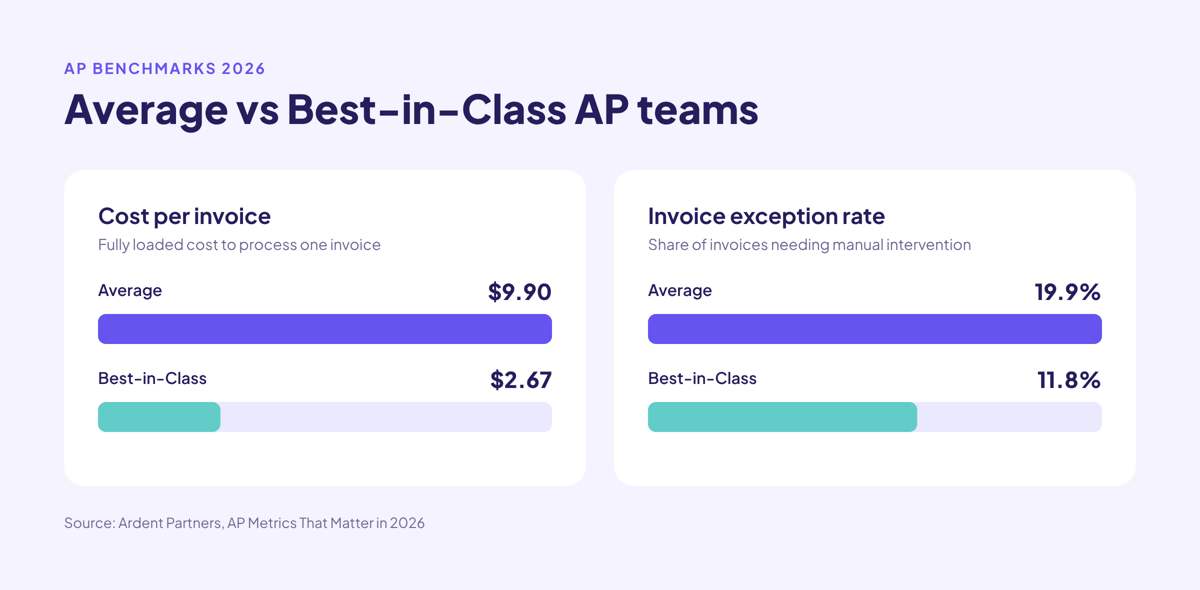
Cost per invoice is the fully loaded expense of processing a single supplier invoice, including labour, software, overhead, and payment fees. Divide your total AP costs by invoices processed in a given period. Our complete guide to cost per invoice walks through the full calculation.
According to Ardent Partners' AP Metrics that Matter in 2026, the average AP team spends $9.90 per invoice. Best-in-class teams bring that down to $2.67. The gap is driven by manual data entry and rework.
Data capture alone accounts for 30% to 35% of total processing cost. Automating those tasks with AI-powered invoice processing software is the fastest way to reduce this number.
Invoice cycle time measures the average number of days from invoice receipt to ready-to-pay status. It shows how quickly invoices move through capture, coding, approval, and posting.
Ardent Partners' 2025 data shows an average of 10.9 days for most AP teams. Best-in-class teams complete the journey in 3.1 days. Most delay sits in approvals, where invoices wait for manual sign-off.
Automated approval routing eliminates email chains and escalates stalled invoices automatically. Faster cycle times also protect your ability to capture early payment discounts.
Invoice exception rate is the percentage of invoices that fail a match or data check and require manual intervention. Divide exception invoices by total invoices processed, then multiply by 100.
The industry average exception rate sits at 19.9%, according to Ardent Partners' 2026 research. Best-in-class teams hold it to 11.8%. Common causes include price mismatches, missing POs, and incorrect vendor data.
Sorting exceptions by root cause each month helps you target the biggest problem first. Automated PO matching and vendor master validation reduce exceptions before they reach your team.
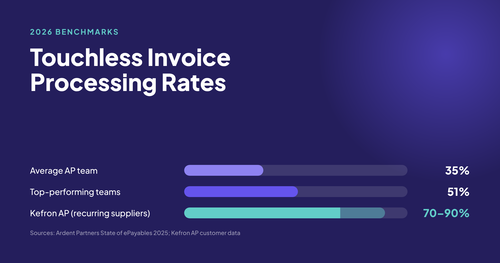
Touchless processing rate measures the percentage of invoices that travel from receipt to ready-to-pay without any manual intervention. It shows how much of your AP workload runs on autopilot.
In Ardent Partners' 2026 research, best-in-class teams process 55.2% of invoices touchless, while all other teams manage 31.4%. Kefron AP customers reach 70–90% touchless processing for recurring suppliers through AI-powered data capture and ERP integration that validates data at the point of entry.
If your exception rate is falling but touchless rate stays flat, look for manual steps on clean invoices, like header keying or GL code selection.
Days payable outstanding measures the average number of days your organisation takes to pay suppliers. The formula: (Average Accounts Payable / Cost of Goods Sold) multiplied by days in the period.
DPO varies by industry. The Hackett Group's 2025 U.S. Working Capital Survey found that the 1,000 largest U.S. public nonfinancial companies averaged 59 days. Your target should reflect your own payment terms.
A high DPO preserves cash but risks straining supplier relationships. A low DPO without corresponding discounts means giving up cash for no benefit. Pay on the due date: not before, not after.
On-time payment rate tracks the percentage of invoices paid on or before the due date. Divide invoices paid on time by total invoices paid, then multiply by 100.
The target is close to 100%, with zero late fees each month. Late approvals, weekly-only payment runs, and missing vendor bank details cause most misses. Each late payment erodes supplier trust.
Reviewing every late fee monthly and tracing it to the responsible step reveals whether the issue is process-related or a cash flow constraint. Automated invoice processing workflows move invoices to approvers faster.
Early payment discount capture rate is the percentage of offered vendor discounts your organisation actually takes. Divide discounts captured by discounts offered, then multiply by 100.
On standard 2/10 net 30 terms, paying 20 days early earns a 2% discount, roughly 36.7% annualised. Even small improvements in capture rate translate into meaningful savings at scale.
This metric is tied directly to cycle time. A 10-day discount window cannot survive a 10.9-day processing cycle. Fix approvals and automation before renegotiating terms.
Invoices processed per full-time employee measures AP team productivity. Divide the total invoices processed in a month by the number of full-time AP staff.
No widely published benchmark exists for this metric, so track your own number monthly and watch the trend. The healthy pattern is invoice volume rising while AP headcount stays flat.
This metric drives staffing decisions. If your team processes 800 invoices per FTE per month and volume is growing, you can estimate when additional headcount is needed. Automation extends each team member's capacity.
Duplicate and erroneous payment rate is the percentage of payments sent twice, to the wrong vendor, or for the wrong amount. Divide duplicate or incorrect payments by total payments, then multiply by 100.
The target is 0%. Any nonzero month warrants a root-cause review. Recovering a bad payment means requesting a refund, chasing it to closure, and reversing accounting entries.
Automated duplicate detection catches most errors before payment. AI-driven systems flag suspicious invoices by cross-referencing invoice numbers, amounts, dates, and vendor details.
Electronic invoice adoption rate measures the proportion of invoices received and processed digitally rather than on paper. Divide electronic invoices by total invoices, then multiply by 100.
A higher electronic rate correlates with faster processing, lower costs, and fewer errors. Paper invoices require scanning, manual entry, and physical storage, each adding time and risk to the invoice processing workflow.
Encouraging suppliers to submit invoices electronically is one of the simplest ways to improve multiple AP metrics at once. Kefron AP accepts invoices from PDF, email, XML, EDI, and scanned documents.
Collecting data is only the first step. The value comes from turning raw numbers into reports that finance leadership can act on. Start by measuring three months of baseline data across the metrics listed above.
Group your metrics by category: efficiency (cost per invoice, cycle time, invoices per FTE), accuracy (exception rate, touchless rate, duplicate payment rate), and cash management (DPO, on-time payment rate, discount capture rate, electronic invoice rate).
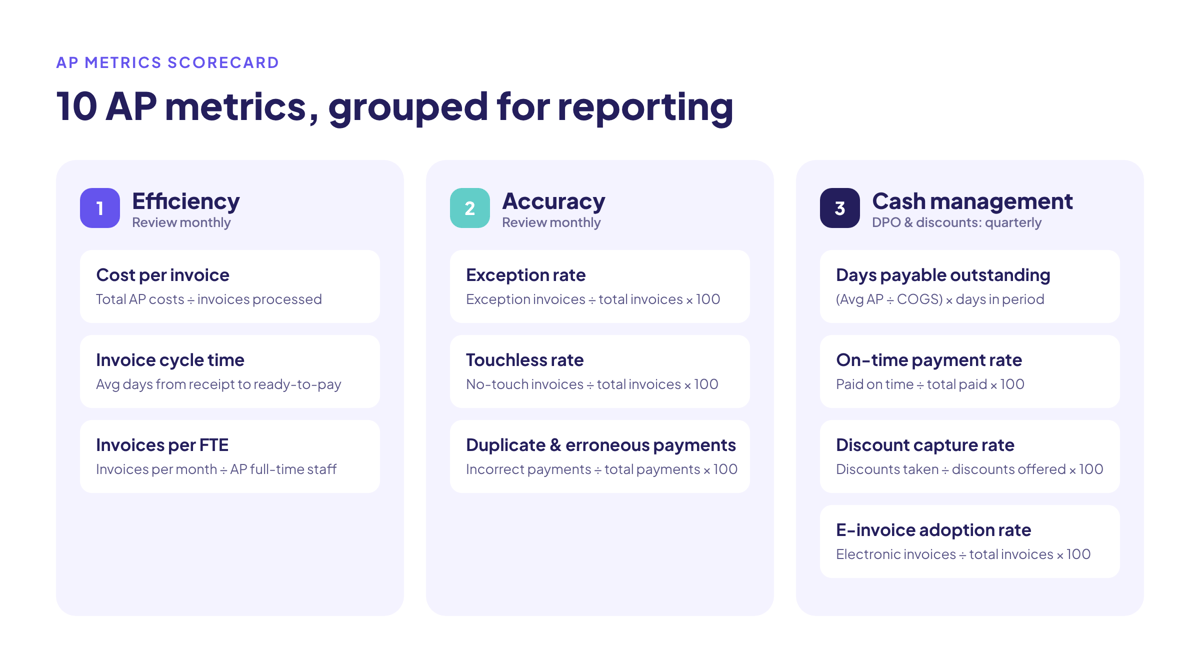
Set targets based on your own baseline, not industry averages alone. Kefron AP provides real-time dashboards that track these metrics automatically, replacing manual spreadsheet work with reliable, always-current reporting.
Cost per invoice is widely considered the most important AP metric because it directly reflects process efficiency and operational costs. A lower cost per invoice typically indicates automated workflows. Track it alongside cycle time and exception rate for a complete picture.
Operational metrics like cycle time, exception rate, and on-time payment rate should be reviewed monthly. Cash and working capital metrics such as DPO and discount capture rate fit better with quarterly reviews, aligned with your financial close cycle.
A touchless rate above 50% is good. Best-in-class AP teams process 55.2% of invoices touchless, according to Ardent Partners' 2026 research. Kefron AP customers reach 70–90% touchless processing for recurring suppliers through AI-powered capture and automated PO matching.
AP automation reduces cost per invoice by eliminating manual data entry. It shortens cycle time by routing approvals automatically and lowers exception rates through automated matching. Together, these improvements free your team to focus on strategic work. See what AP automation ROI looks like in 2026.
A metric is any number that tracks how your AP process performs. A KPI is a metric you have tied to a specific target and review on a set schedule. For example, cost per invoice is a metric. "Cost per invoice under $5 by Q4" is a KPI.
Start by measuring three months of your own baseline data using consistent definitions. Then compare your results to published benchmarks from sources like APQC's cross-industry AP benchmarks. Use the comparison to identify gaps and set improvement targets.