AP Analytics Dashboards for Real-Time AP Reporting and Visibility

Get a complete view of AP performance with real-time dashboards for AP reporting, invoice analytics, and workflow visibility. Track bottlenecks, delays, and processing trends instantly.

Why AP Analytics Matter

Real-time AP analytics improve decision-making, forecasting, and financial control by highlighting bottlenecks and reporting issues early. Reduce manual reporting with consolidated AP insights.

Spot bottlenecks early

by seeing exactly where invoices slow down or get stuck.

Improve cash flow forecasting

with real-time visibility into ageing, liabilities & approval delays.

Reduce manual effort

by eliminating spreadsheets and having insights in one place.

Improve supplier performance

and internal SLAs through full transparency.

Explore Our AP Analytics Dashboards and Reports

Access all AP reporting, AP automation analytics, and invoice analytics in one centralised view. Understand ageing, exceptions, performance trends, and workflow blockers instantly.

Ageing Dashboard

Track unpaid invoices by value and time to quickly identify overdue items and manage liabilities with confidence.

Extraction Analytics

See which suppliers or documents cause the most extraction errors, as to address issues and reduce delays.

ROI Dashboard

Track time saved, touchless processing improvements, and duplicate invoice prevention at a glance.

User Productivity Dashboard

Monitor performance, approval delays, and workload distribution to improve collaboration and keep invoices moving.

Received vs Processed

Compare incoming invoices vs processed ones to spot capacity constraints and processing bottlenecks in real time.


Verification & PO Matching

Identify suppliers, invoices, or PO mismatches that slow down processing, and pinpoint where improvements are needed.

Core AP KPIs You Can Track in Kefron AP

Get real-time AP automation analytics across the KPIs that matter most – from cycle times and approval speed to supplier performance and processing costs.

tick-green

Invoice Cycle Time

How long invoices take from receipt to approval.

tick-green

Touchless Processing Rate

% of invoices processed without manual intervention.

tick-green

Approval Turnaround Time

How quickly approvers move invoices forward.

tick-green

Exception Rate

Frequency of errors, mismatches, or intervention-required invoices. 

tick-green

Duplicate Detection

Automatically identified and prevented duplicate invoices.

tick-green

On-Time Payment %

How often suppliers are paid on time.

tick-green

Supplier Performance

From extraction errors, recurring mismatches to issue patterns.

tick-green

IPC per Invoice

Measures the total cost to process each invoice.

Real-Time AP Reporting Without Spreadsheets

All your key AP metrics – approvals, exceptions, extraction errors, match rates, and ageing – updated automatically in real time. Spend less time collecting data and more time improving the process.

Automated Invoice Capture & Processing Supplier Self-Service Portal Automated Invoice & PO Matching Smart Workflows & Approvals
Automated Invoice Capture & Processing

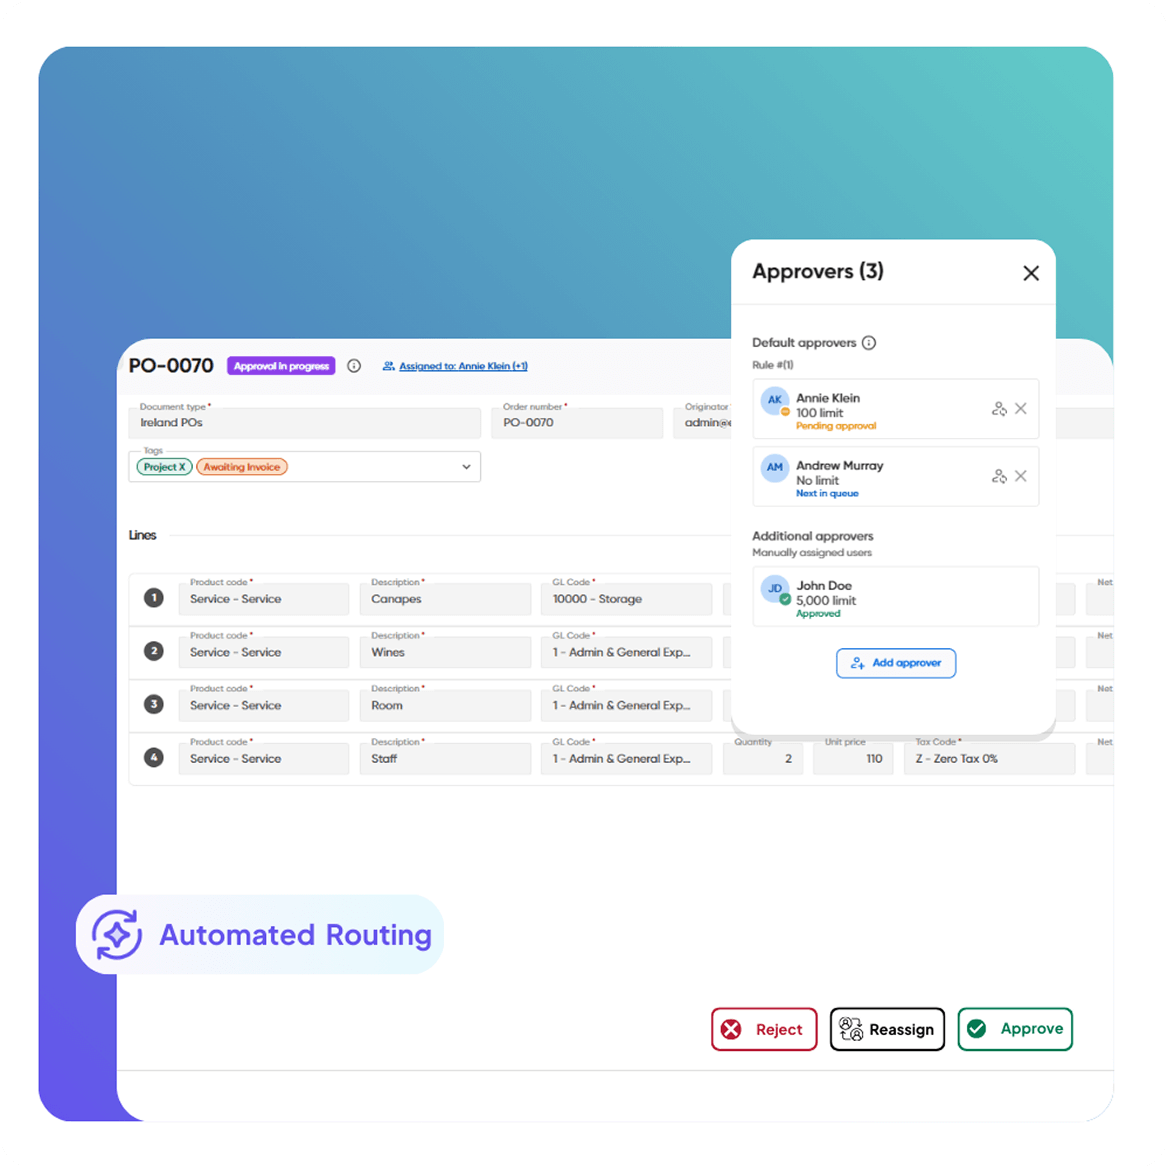
Simplified AP Reporting

Spot workflow issues instantly. Whether delays come from extraction errors, slow approvers, or supplier inconsistencies, Kefron AP highlights them so you can fix root causes and speed up reporting.

Supplier Self-Service Portal

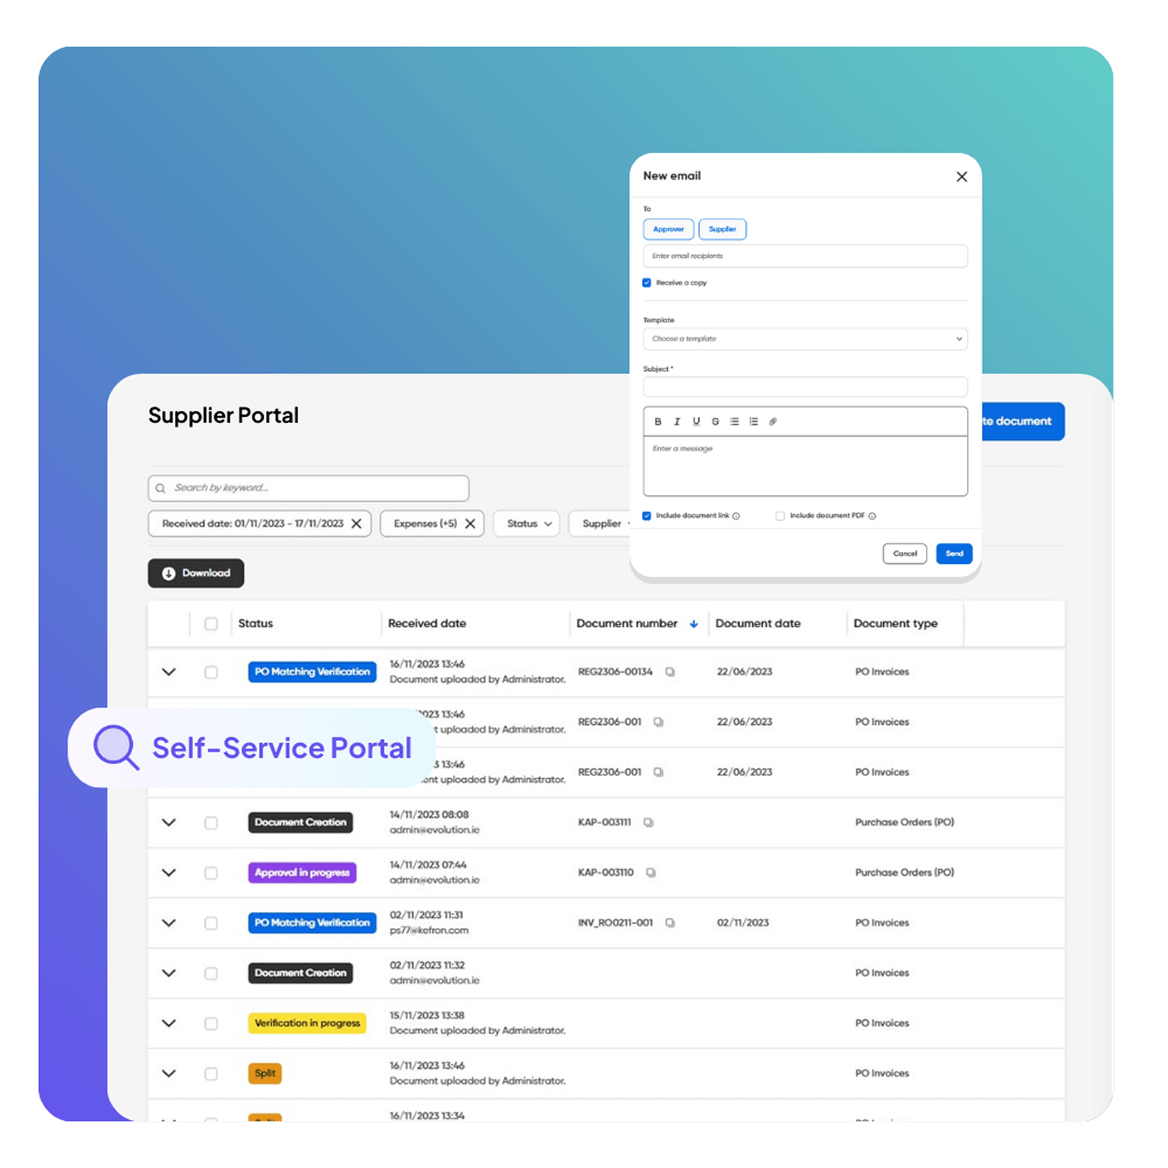
360° Invoice Tracking

See every invoice’s journey at a glance. Real-time visibility helps your team move from reactive troubleshooting to proactive planning, improving cash flow forecasting and month-end accuracy.

Automated Invoice & PO Matching

Real-Time AP Analytics

Stop digging through emails, folders, or Excel without an end. Access all key metrics instantly, including cycle times, exceptions, liabilities, touchless rates, and Accounts Payable Ageing reports.
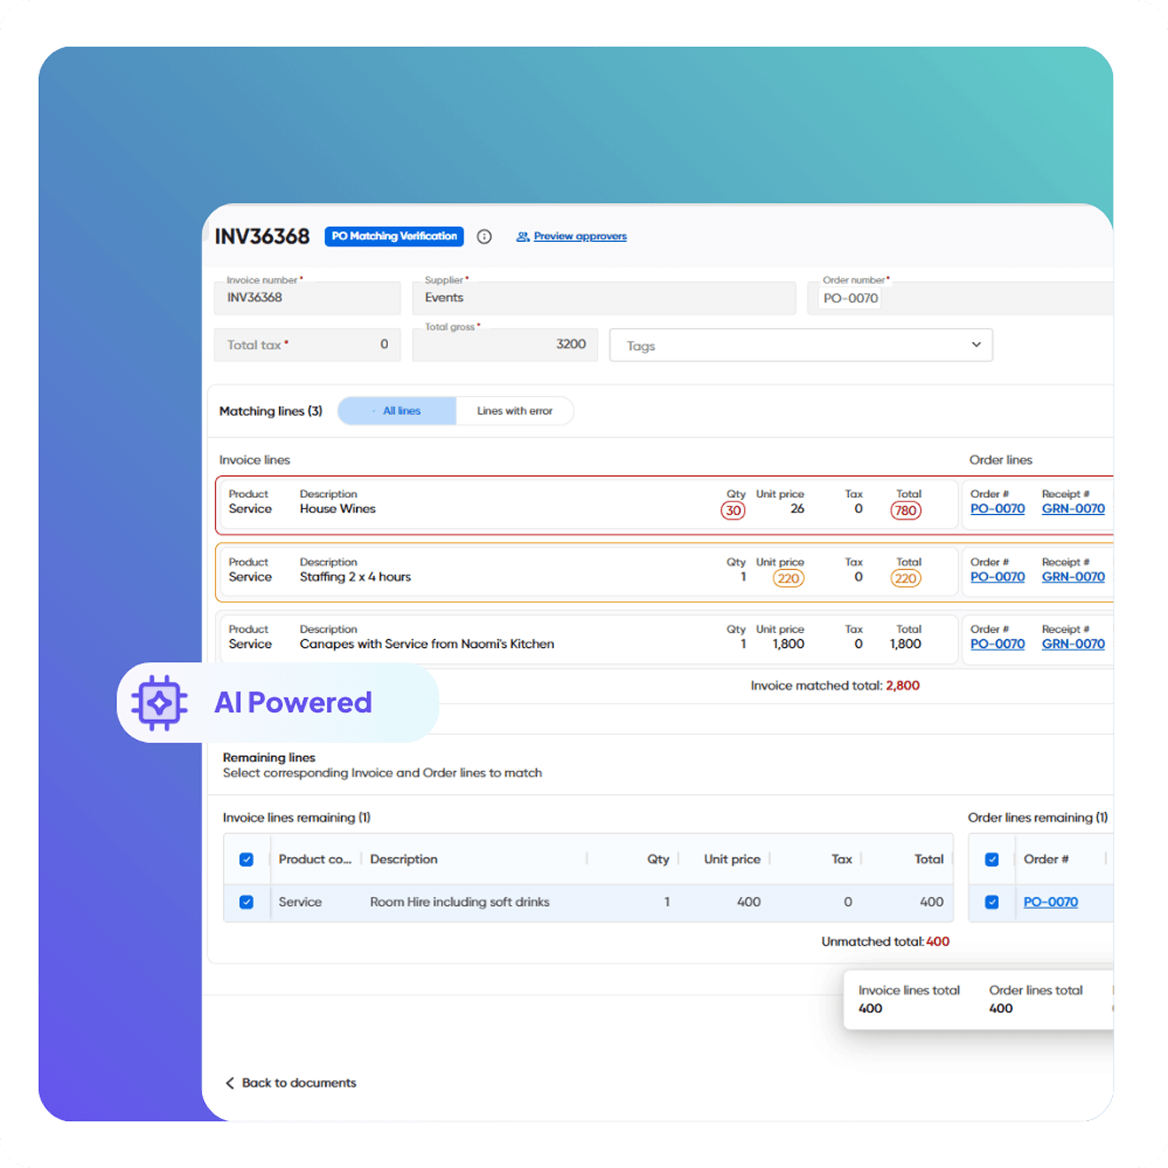
Smart Workflows & Approvals

Process Improvement

Kefron AP learns from new supplier invoices and improves extraction accuracy over time – continuously – helping your finance team reduce repetitive fixes and resolve supplier issues faster.

CASE STUDIES:

Real Results from Real Finance Teams

See how finance leaders have reduced costs, improved accuracy, and gained complete visibility with accounts payable automation. 

Ready to See Your AP Performance in Real Time?

Experience how Kefron AP visualises bottlenecks, approvals, exceptions, and supplier performance, all in one central dashboard.

feature-cta-img

Frequently asked questions:

What is an AP analytics dashboard?

An AP analytics dashboard is a real-time view of your accounts payable process that turns invoice, supplier and payment data into clear KPIs like cycle time, exceptions, approvals and invoice ageing. It helps finance teams spot bottlenecks, monitor liabilities and improve working capital without manual spreadsheets.

What insights do AP analytics dashboards provide?

AP dashboards show where invoices slow down (approver delays, extraction errors, PO match issues), how teams perform, and which suppliers or entities create the most exceptions. This makes it easy to prioritise fixes with the biggest impact.

What are AP Analytics Dashboards?

AP Analytics Dashboards give you real-time visibility into your AP process – including approval delays, extraction errors, PO match issues, team performance, bottlenecks, and invoice ageing – without needing spreadsheets or manual reporting.

Which KPIs should be on an AP performance dashboard?

Typical AP KPIs include average approval time, straight-through (touchless) processing rate, exception rate, cost per invoice, invoices per FTE, overdue invoices, and DPO. Together they link AP performance to working-capital outcomes.

Can I customise the dashboards for my organisation?

Yes. Dashboards can be customised and filtered by supplier, entity, department, user, invoice type, date range, and workflow stage so you can track precisely what matters to your AP team and finance leadership.

Does this replace manual Excel reporting?

Yes. Kefron AP eliminates the need to export, consolidate, and organise data manually. All key KPIs (cycle times, touchless rate, exceptions, ageing, etc.) are updated automatically.

How quickly can my team start using the dashboards?

Dashboards are available as soon as your workflow and ERP integration go live, typically within 6–8 weeks of implementation.

Why do finance teams use AP analytics dashboards?

Finance and AP teams use dashboards to track speed, accuracy and cost per invoice, then benchmark performance over time. Real-time AP reporting also supports better cash-flow decisions, on-time payments and early-discount capture.

What’s the difference between AP reporting and accounting reporting?

AP reporting focuses on invoice lifecycle performance approvals, exceptions, payments and processing KPIs. Accounting reporting focuses on financial statements and period close. Accurate AP dashboards feed cleaner payables data into accounting reports, improving accruals, compliance and cash forecasting. 

What should invoice analytics measure?

Invoice analytics should track cycle time from receipt to payment, first-time match rate, exception frequency, approval time, and discount capture. These KPIs highlight efficiency gaps, leakage risks and compliance issues.

How does Kefron AP ensure the data in the dashboards is accurate?

Kefron AP combines AI-powered extraction with Human Assurance to achieve 99%+ accuracy. Because the data is clean from the start, dashboards are reliable and actionable – unlike OCR-based systems that require manual corrections.

How do AP dashboards help reduce bottlenecks?

Dashboards highlight where invoices consistently slow down, whether due to extraction issues, slow approvers, supplier errors, or PO mismatches, so you can fix root causes and keep the process moving efficiently.

Is the analytics feature included with the platform or does it cost extra?

Analytics dashboards are included as part of the core Kefron AP platform, no add-ons or separate modules required.